News and research before you hear about it on CNBC and others. Claim your 1-week free trial to StreetInsider Premium here.
UNITED STATES
SECURITIES AND EXCHANGE COMMISSION
Washington, D.C. 20549
FORM N-CSR
CERTIFIED SHAREHOLDER REPORT OF REGISTERED
MANAGEMENT INVESTMENT COMPANIES
Investment Company Act File Number: 811-09995
| T. Rowe Price Global Technology Fund, Inc. |
| (Exact name of registrant as specified in charter) |
| 100 East Pratt Street, Baltimore, MD 21202 |
| (Address of principal executive offices) |
| David Oestreicher |
| 100 East Pratt Street, Baltimore, MD 21202 |
| (Name and address of agent for service) |
Registrant’s telephone number, including area code: (410) 345-2000
Date of fiscal year end: December 31
Date of reporting period: June 30, 2021
Item 1. Reports to Shareholders
(a) Report pursuant to Rule 30e-1.
|
Global Technology Fund |
June 30, 2021 |
| PRGTX | Investor Class |
| PGTIX | I Class |
| T. ROWE PRICE GLOBAL TECHNOLOGY FUND |
HIGHLIGHTS
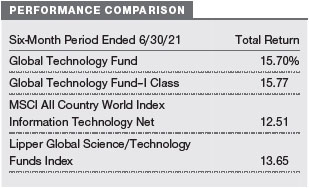
| ■ | The Global Technology Fund returned 15.70% for the period, beating the MSCI All Country World Index Information Technology Net and its peer group, as proxied by the Lipper Global Science/Technology Funds Index. |
| ■ | Astute stock picking, particularly among fast-growing internet companies, along with a significant underweight in hardware, which underperformed the market, accounted for much of the portfolio’s strong performance. |
| ■ | We sought to reduce risk by selling internet and semiconductor stocks to harvest long-term gains and reinvest in other subsectors offering better potential at this time. |
| ■ | We continue to research investments that are driven more by emerging trends in technology and long-term secular growth themes than by short-term cash flows tied to the current economic cycle. |

Log in to your account at troweprice.com for more information.
*Certain mutual fund accounts that are assessed an annual account service fee can also save money by switching to e-delivery.
CIO Market Commentary
Dear Shareholder
Global stock markets produced strong returns during the first half of 2021, while rising yields weighed on returns in some bond sectors. Investor sentiment was buoyed by the reopening of developed market economies, unprecedented fiscal and monetary stimulus, and expectations that the economy would benefit from a release of pent-up demand.
All major global and regional equity benchmarks recorded positive results during the period. Developed market stocks generally outperformed emerging markets, while in the U.S., small-cap equities outpaced large-caps and value performed better than growth. The large-cap S&P 500 Index returned 15% and finished the period at a record high. The energy sector, which was the worst performer in 2020, was the leader for the six-month period amid a sharp increase in oil prices. Financial stocks also produced strong results as banks benefited from an increase in long-term interest rates, while the real estate sector was helped by a rollback in many pandemic-related restrictions. Utilities underperformed with slight gains.
Fiscal and monetary support remained a key factor in providing a positive backdrop for markets. President Joe Biden signed the $1.9 trillion American Rescue Plan Act into law in March, and the Federal Reserve kept its short-term lending rates near zero. However, as a result of strong economic growth, central bank policymakers revised their outlook in a somewhat less dovish direction near the end of the period and indicated that rate hikes could commence in 2023, which was earlier than previously expected.
The economic recovery was evident in a variety of indicators. According to the latest estimate, U.S. gross domestic product grew at an annualized rate of 6.4% in the first quarter of 2021 following 4.3% growth in the fourth quarter of 2020. Weekly jobless claims declined throughout the period to new pandemic-era lows, although the monthly nonfarm payroll report disappointed at times as employers struggled to fill positions. Meanwhile, overall profits for companies in the S&P 500 rose by nearly 53% year over year in the first quarter, according to FactSet—the best showing since late 2009.
However, less favorably, inflation concerns led to some volatility in the equity market and caused a sharp rise in longer-term Treasury yields in the first quarter. (Bond prices and yields move in opposite directions.) While inflation measures were above the Fed’s 2% long-term inflation target toward the end of our reporting period—core consumer prices, for example, recorded their largest annual increase (3.8%) since 1992 in May—investors seemed to accept the Fed’s determination that rising price pressures were due to transitory factors arising from the reopening of the global economy.
Longer-term Treasury yields trended lower as inflation expectations began to wane later in the period, but they still finished significantly higher than they were at the end of 2020. Rising yields were a headwind for many fixed income investors; however, high yield bonds, which are less sensitive to interest rate changes, produced solid results, and investment-grade corporate bonds also performed well amid solid corporate fundamentals.
As we look ahead, the central question for investors—assuming the economy’s recovery from the pandemic continues apace—is whether the returns on financial assets will be as robust. Valuations are elevated in nearly all asset classes, and, in some areas, there are clear signs of speculation. That said, a transformed global economic landscape is generating potential opportunities as well as risks. Post-pandemic trends have the potential to create both winners and losers, giving active portfolio managers greater scope to seek excess returns. It is not an easy environment to invest in, but our investment teams remain rooted in company fundamentals and focused on the long term, and they will continue to apply strong fundamental analysis as they seek out the best investments for your portfolio.
Thank you for your continued confidence in T. Rowe Price.
Sincerely,

Robert Sharps
Group Chief Investment Officer
Management’s Discussion of Fund Performance
INVESTMENT OBJECTIVE
The fund seeks to provide long-term capital growth.
FUND COMMENTARY
How did the fund perform in the past six months?
The Global Technology Fund returned 15.70% in the six months ended June 30, 2021, beating the MSCI All Country World Index Information Technology Net and the Lipper Global Science/Technology Funds Index. (Returns for the I Class shares reflect its different fee structure. Past performance cannot guarantee future results.)
What factors influenced the fund’s performance?
The distribution of COVID-19 vaccines and the easing of restrictions in many places provided the key support that was needed to unlock corporate earnings and fuel a broad-based economic recovery, one that pushed global equity prices up, including those of technology companies. The Global Technology Fund navigated a market rotation away from technology stocks and toward cyclicals early in the period to finish strong. By fine-tuning the portfolio, we were able to increase exposure to high-conviction stocks that provided the strong fundamentals needed to sustain returns.
Avoiding hardware stocks contributed the most to relative performance during the period as the returns generated from this subsector fell short of other subsectors. Not owning Apple—which accounts for a large portion of the subsector’s return—helped, as the stock underperformed. Despite meeting estimates, the iPhone 12 supercycle slowed, and market concerns about future revenue growth pressured shares. We prefer businesses that can sustain higher levels of growth in the coming years, in our opinion, and offer better potential returns given the valuation.
Our stock choices in internet added to performance. The share price of Sea, predominantly an internet platform operating in Southeast Asia, rallied from first-quarter lows to attain new highs by the end of the period based largely on a flurry of product and market expansion activities that served to increase its total market opportunity. In addition, our holding in Facebook spiked after its first-quarter earnings report showed strong digital advertising results, helping the company beat revenue and earnings per share estimates. Finally, shares of Snap rose steadily over the period capped by the release of its plans to monetize engagement in Snap Originals, a vertical series of shows that users can view in the app.
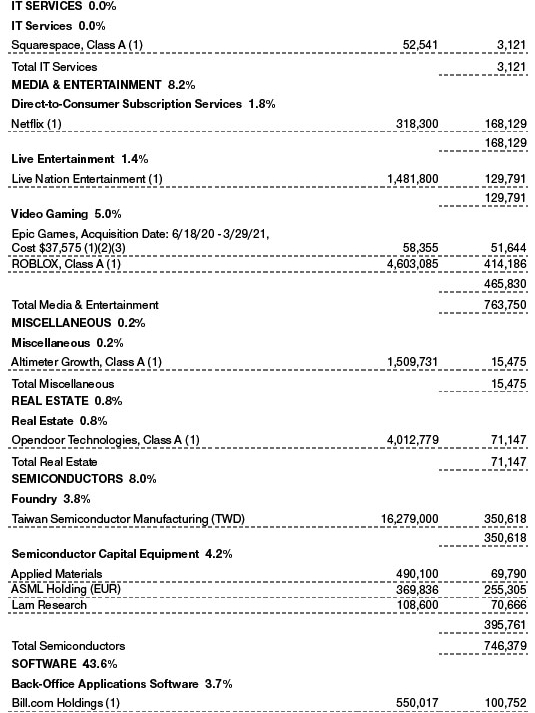
The positive effects of stock selection in media and entertainment also yielded results. Shares of ROBLOX jumped after it reported strong quarterly earnings. ROBLOX is an online game developer with a mission to build shared 3D-gaming experiences. We are attracted to the firm’s active content creator developer base and the powerful social network effects ROBLOX utilizes to draw in new users.
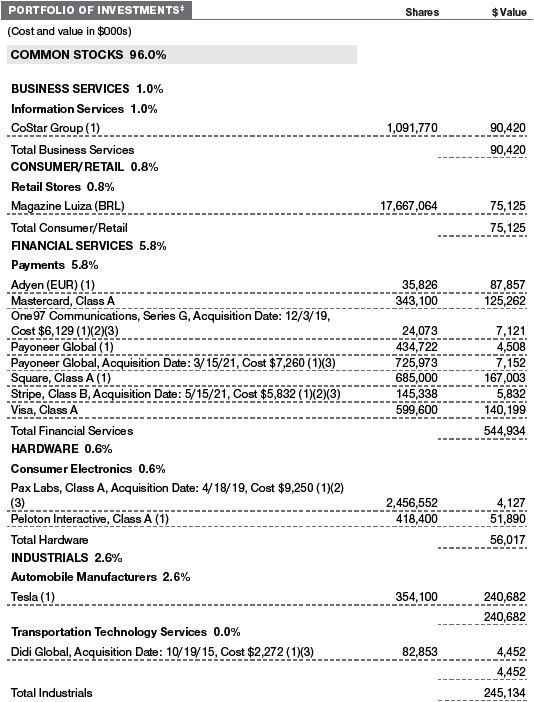
In contrast, our allocation in real estate lowered relative returns the most. Opendoor Technologies, the portfolio’s only investment in this area, fell sharply after it released its first-quarter report in which it beat revenue estimates but showed weaker-than-expected gross margins on those sales. Opendoor is a leading digital platform for residential real estate, providing an end-to-end online buying and selling experience in a growing number of U.S. markets.
The portfolio’s exposure to industrials also weighed on relative returns. While these negative effects were partially offset by good stock selection, they lowered relative returns overall. Tesla, the portfolio’s single investment in industrials, traded lower after the company announced a delay in the opening of its highly anticipated plant in Germany.
Finally, in software, not holding Microsoft led to underperformance, as shares of the software giant rose on continued positive news surrounding its cloud initiatives. In another example of underperformance, our investment in Workday, a global developer of back-office software, fell in value after it lowered its earnings forecast for the year. It attributed the change to decelerating subscription revenues tied to lingering coronavirus headwinds. However, our investment in HubSpot, a cloud-based marketing and content management solutions firm, ameliorated some of these misses by generating strong returns tied to its subscription growth and market expansion activities this year.
How is the fund positioned?
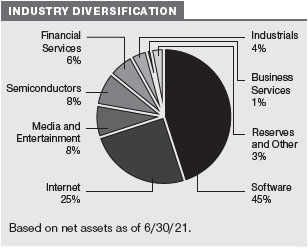
While some investors may have moved away from technology stocks during the period, we focused on honing the portfolio, matching position size with our level of conviction, and attempting to invest in high-quality stocks that stand to benefit the most from the growing digital economy across a broad array of vertical markets. In addition, we leaned into emerging trends in online gaming and social video. We funded these purchases by selling internet stocks that appeared to have less upside potential than others. In addition, we significantly reduced our semiconductor allocation due to our bearish medium-term assessments. We used many of the gains made in these areas to help fund other positions that we believe possess better risk/reward profiles at this time.
In software, we bought shares of stocks that showed market share growth and strong cash flows. In many cases, these high-conviction names have been able to maintain much of the momentum they exhibited during the height of the pandemic lockdowns last year. In contrast, we sold shares of lower-conviction companies that have not executed as well against near-term opportunities. For example, we increased our positions in Zoom Video Communications and HubSpot, two companies that have benefited from the product line expansion and extended market opportunities. Concurrently, we eliminated our position in Salesforce.com shortly after its acquisition of Slack Technologies to invest in companies that can more closely align with emerging needs for application integration and customization. We also pared back our position in Workday, a leader in human capital software, as it continues to develop its plans for penetrating other enterprise segments.
Within internet, we sought to reduce risk and increase potential returns by exiting our positions in Chinese tech giants Alibaba Group Holding and Tencent and trimming Farfetch, a unique online platform that is well positioned among boutiques, luxury brands, and consumers in the growing global luxury goods market. While we appreciate Alibaba’s leadership role in China’s e-commerce and cloud computing markets, increased regulatory and competitive challenges weighed on our decision. On the other hand, we added Coupang, a leading South Korean e-commerce company. We recognize its ability to leverage its competitive advantage in logistics technology to offer consumers better product selection, faster shipping, and lower prices, and, in doing so, it continues to grow its market share and profits. We also added to our position in Etsy, an online marketplace for unique, creative, and often homemade goods. We believe its recent purchase of Depop, a fashion resale marketplace catering to Generation Z buyers, will add to its growth runway over the long term.
We added to our positions in media and entertainment, increasing our stake in Live Nation Entertainment, a leading global live entertainment company engaged in managing artists and operating venues, including handling event sales through its Ticketmaster unit. Its shares rose as many economies began to reopen, ushering in a return of summer concert tours along with fans. In addition, we added 3D-gaming developer ROBLOX to the portfolio and grew our position during the period. We are attracted to the firm’s active content creator developer base and believe it can leverage social network effects to grow its user base.
Finally, the relative value of semiconductor stocks continued to wane as we progressed further into the semiconductor cycle, according to our research. We reduced our allocation to these stocks by shedding positions that have run their course. For instance, we exited our position in Samsung Electronics as we expect demand to slow for dynamic random-access memory chips, a product that makes up a significant portion of its business. Similarly, we eliminated Micron Technology, a U.S.-based leader in memory and storage, given our estimate that we are late in the cycle for memory chips. Finally, we liquidated our position in Infineon Technologies, a leading maker of automotive and industrial semiconductors based in Germany as we believe the supply shortages of its largest end market, automotive, will likely end next year.
What is portfolio management’s outlook?
In our current environment in which stock prices seem to be influenced more by market sentiment than by fundamentals, we have been pleased to see many of our positions—shaped by our long-term thinking—perform well, nonetheless. Often, our bets align with emerging trends in technology. In software, for example, several of our stocks are positioned to potentially benefit from the “consumerization of enterprise,” a trend where solutions are developed and marketed to end users rather than to top executives. This trend has been fueled by the growing competition in enterprise software, an increase in tech-savvy users, and a shortage of developers. The growing number of software tools targeting lower-skilled IT workers to help them develop customized, easy-to-use applications is a symptom of the developer shortage. Another emerging trend that we believe may have long-term implications for enterprise value is social commerce. The companies that benefit from monetizing social networks are not only established social media platforms but also e-commerce companies. Finally, within e-commerce, we recognize that the proliferation of different business models and geographies and the advancement of logistics technology point to an accelerating and investable trend that is likely to be lasting: food and convenience delivery. Our global research platform maintains incredible coverage and insights into many of the emerging and disruptive trends in the broader technology sector. Importantly, we factor in a company’s relationship to emerging trends like these in our attempt to create a portfolio that is on the right side of change.
The views expressed reflect the opinions of T. Rowe Price as of the date of this report and are subject to change based on changes in market, economic, or other conditions. These views are not intended to be a forecast of future events and are no guarantee of future results.
RISKS OF INVESTING IN THE FUND
Securities of companies in the same industry may decline in price at the same time due to industry-specific developments since these companies may share common characteristics and are more likely to react similarly to industry-specific market or economic developments. Since this fund is focused on technology companies, it is less diversified than stock funds investing in a broader range of industries and, therefore, could experience significant volatility. In addition, technology stocks historically have experienced unusually wide price swings, both up and down. The potential for wide variation in performance reflects the special risks common to companies in the rapidly changing technology sector. For example, products or services that at first appear promising may not prove commercially successful or may become obsolete quickly. Earnings disappointments and intense competition for market share can result in sharp price declines.
BENCHMARK INFORMATION
Note: MSCI makes no express or implied warranties or representations and shall have no liability whatsoever with respect to any MSCI data contained herein. The MSCI data may not be further redistributed or used as a basis for other indices or any securities or financial products. This report is not approved, reviewed, or produced by MSCI.
Note: Lipper, a Thomson Reuters Company, is the source for all Lipper content reflected in these materials. Copyright 2021 © Refinitiv. All rights reserved. Any copying, republication or redistribution of Lipper content is expressly prohibited without the prior written consent of Lipper. Lipper shall not be liable for any errors or delays in the content, or for any actions taken in reliance thereon.
![]()
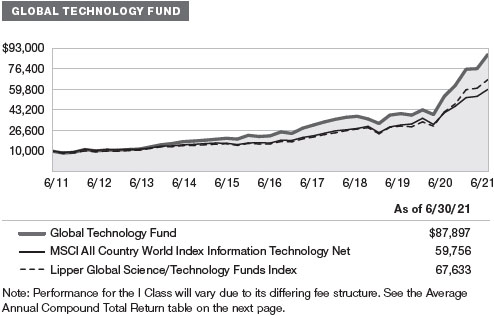
GROWTH OF $10,000
This chart shows the value of a hypothetical $10,000 investment in the fund over the past 10 fiscal year periods or since inception (for funds lacking 10-year records). The result is compared with benchmarks, which include a broad-based market index and may also include a peer group average or index. Market indexes do not include expenses, which are deducted from fund returns as well as mutual fund averages and indexes.
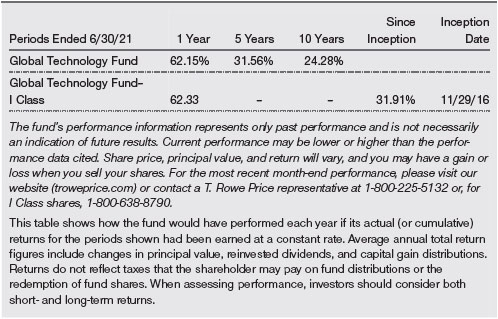
AVERAGE ANNUAL COMPOUND TOTAL RETURN
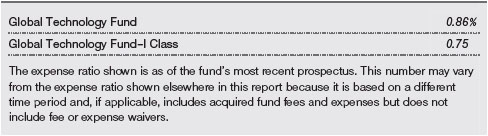
EXPENSE RATIO
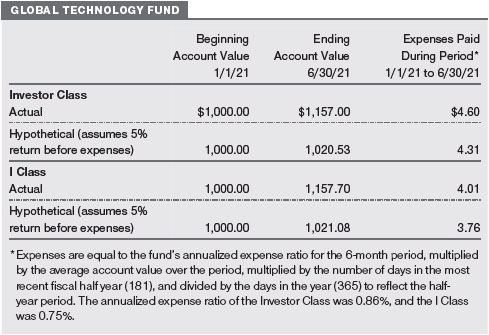
FUND EXPENSE EXAMPLE
As a mutual fund shareholder, you may incur two types of costs: (1) transaction costs, such as redemption fees or sales loads, and (2) ongoing costs, including management fees, distribution and service (12b-1) fees, and other fund expenses. The following example is intended to help you understand your ongoing costs (in dollars) of investing in the fund and to compare these costs with the ongoing costs of investing in other mutual funds. The example is based on an investment of $1,000 invested at the beginning of the most recent six-month period and held for the entire period.
Please note that the fund has two share classes: The original share class (Investor Class) charges no distribution and service (12b-1) fee, and the I Class shares are also available to institutionally oriented clients and impose no 12b-1 or administrative fee payment. Each share class is presented separately in the table.
Actual Expenses
The first line of the following table (Actual) provides information about actual account values and expenses based on the fund’s actual returns. You may use the information on this line, together with your account balance, to estimate the expenses that you paid over the period. Simply divide your account value by $1,000 (for example, an $8,600 account value divided by $1,000 = 8.6), then multiply the result by the number on the first line under the heading “Expenses Paid During Period” to estimate the expenses you paid on your account during this period.
Hypothetical Example for Comparison Purposes
The information on the second line of the table (Hypothetical) is based on hypothetical account values and expenses derived from the fund’s actual expense ratio and an assumed 5% per year rate of return before expenses (not the fund’s actual return). You may compare the ongoing costs of investing in the fund with other funds by contrasting this 5% hypothetical example and the 5% hypothetical examples that appear in the shareholder reports of the other funds. The hypothetical account values and expenses may not be used to estimate the actual ending account balance or expenses you paid for the period.
Note: T. Rowe Price charges an annual account service fee of $20, generally for accounts with less than $10,000. The fee is waived for any investor whose T. Rowe Price mutual fund accounts total $50,000 or more; accounts electing to receive electronic delivery of account statements, transaction confirmations, prospectuses, and shareholder reports; or accounts of an investor who is a T. Rowe Price Personal Services or Enhanced Personal Services client (enrollment in these programs generally requires T. Rowe Price assets of at least $250,000). This fee is not included in the accompanying table. If you are subject to the fee, keep it in mind when you are estimating the ongoing expenses of investing in the fund and when comparing the expenses of this fund with other funds.
You should also be aware that the expenses shown in the table highlight only your ongoing costs and do not reflect any transaction costs, such as redemption fees or sales loads. Therefore, the second line of the table is useful in comparing ongoing costs only and will not help you determine the relative total costs of owning different funds. To the extent a fund charges transaction costs, however, the total cost of owning that fund is higher.
Unaudited
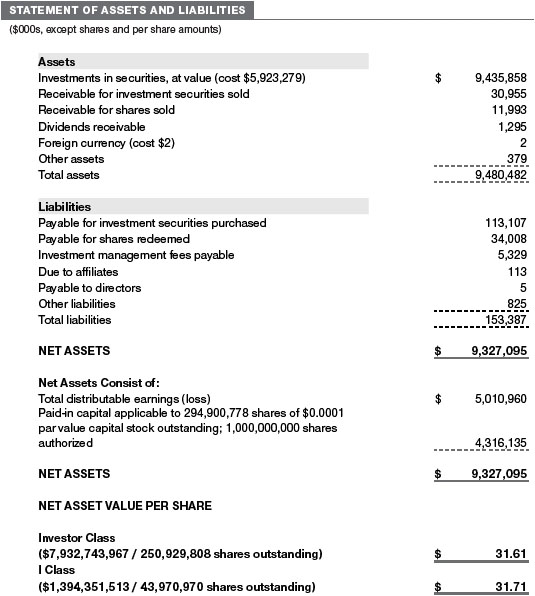
The accompanying notes are an integral part of these financial statements.
Unaudited
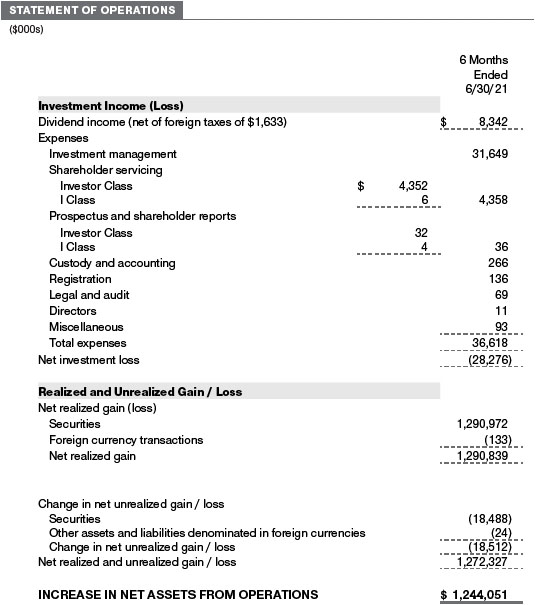
The accompanying notes are an integral part of these financial statements.
June 30, 2021 (Unaudited)
![]()
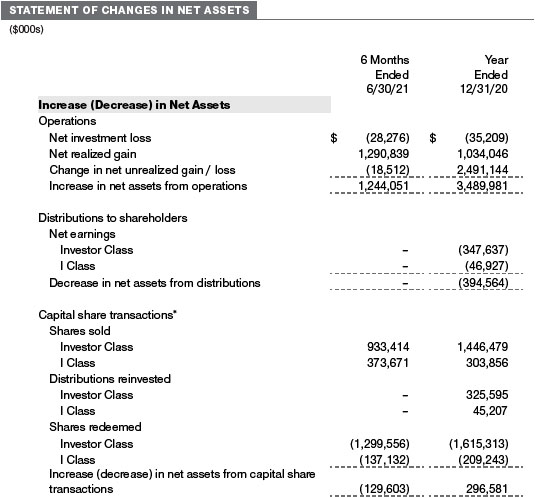
The accompanying notes are an integral part of these financial statements.
June 30, 2021 (Unaudited)
The accompanying notes are an integral part of these financial statements.
Unaudited
The accompanying notes are an integral part of these financial statements.
Unaudited
![]()
The accompanying notes are an integral part of these financial statements.
Unaudited
| NOTES TO FINANCIAL STATEMENTS |
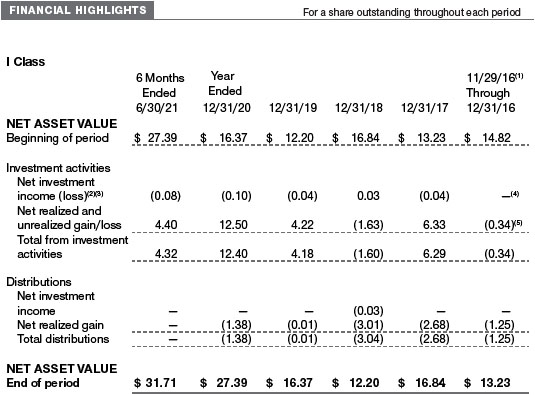
T. Rowe Price Global Technology Fund, Inc. (the fund) is registered under the Investment Company Act of 1940 (the 1940 Act) as a nondiversified, open-end management investment company. The fund seeks to provide long-term capital growth. The fund has two classes of shares: the Global Technology Fund (Investor Class) and the Global Technology Fund–I Class (I Class). I Class shares require a $1 million initial investment minimum, although the minimum generally is waived for retirement plans, financial intermediaries, and certain other accounts. Each class has exclusive voting rights on matters related solely to that class; separate voting rights on matters that relate to both classes; and, in all other respects, the same rights and obligations as the other class.
NOTE 1 – SIGNIFICANT ACCOUNTING POLICIES
Basis of Preparation The fund is an investment company and follows accounting and reporting guidance in the Financial Accounting Standards Board (FASB) Accounting Standards Codification Topic 946 (ASC 946). The accompanying financial statements were prepared in accordance with accounting principles generally accepted in the United States of America (GAAP), including, but not limited to, ASC 946. GAAP requires the use of estimates made by management. Management believes that estimates and valuations are appropriate; however, actual results may differ from those estimates, and the valuations reflected in the accompanying financial statements may differ from the value ultimately realized upon sale or maturity.
Investment Transactions, Investment Income, and Distributions Investment transactions are accounted for on the trade date basis. Income and expenses are recorded on the accrual basis. Realized gains and losses are reported on the identified cost basis. Income tax-related interest and penalties, if incurred, are recorded as income tax expense. Dividends received from mutual fund investments are reflected as dividend income; capital gain distributions are reflected as realized gain/loss. Dividend income and capital gain distributions are recorded on the ex-dividend date. Non-cash dividends, if any, are recorded at the fair market value of the asset received. Distributions to shareholders are recorded on the ex-dividend date. Income distributions, if any, are declared and paid by each class annually. A capital gain distribution may also be declared and paid by the fund annually.
Currency Translation Assets, including investments, and liabilities denominated in foreign currencies are translated into U.S. dollar values each day at the prevailing exchange rate, using the mean of the bid and asked prices of such currencies against U.S. dollars as provided by an outside pricing service. Purchases and sales of securities, income, and expenses are translated into U.S. dollars at the prevailing exchange rate on the respective date of such transaction. The effect of changes in foreign currency exchange rates on realized and unrealized security gains and losses is not bifurcated from the portion attributable to changes in market prices.
Class Accounting Shareholder servicing, prospectus, and shareholder report expenses incurred by each class are charged directly to the class to which they relate. Expenses common to both classes, investment income, and realized and unrealized gains and losses are allocated to the classes based upon the relative daily net assets of each class.
Capital Transactions Each investor’s interest in the net assets of the fund is represented by fund shares. The fund’s net asset value (NAV) per share is computed at the close of the New York Stock Exchange (NYSE), normally 4 p.m. ET, each day the NYSE is open for business. However, the NAV per share may be calculated at a time other than the normal close of the NYSE if trading on the NYSE is restricted, if the NYSE closes earlier, or as may be permitted by the SEC. Purchases and redemptions of fund shares are transacted at the next-computed NAV per share, after receipt of the transaction order by T. Rowe Price Associates, Inc., or its agents.
Indemnification In the normal course of business, the fund may provide indemnification in connection with its officers and directors, service providers, and/or private company investments. The fund’s maximum exposure under these arrangements is unknown; however, the risk of material loss is currently considered to be remote.
NOTE 2 – VALUATION
Fair Value The fund’s financial instruments are valued at the close of the NYSE and are reported at fair value, which GAAP defines as the price that would be received to sell an asset or paid to transfer a liability in an orderly transaction between market participants at the measurement date. The T. Rowe Price Valuation Committee (the Valuation Committee) is an internal committee that has been delegated certain responsibilities by the fund’s Board of Directors (the Board) to ensure that financial instruments are appropriately priced at fair value in accordance with GAAP and the 1940 Act. Subject to oversight by the Board, the Valuation Committee develops and oversees pricing-related policies and procedures and approves all fair value determinations. Specifically, the Valuation Committee establishes policies and procedures used in valuing financial instruments, including those which cannot be valued in accordance with normal procedures or using pricing vendors; determines pricing techniques, sources, and persons eligible to effect fair value pricing actions; evaluates the services and performance of the pricing vendors; oversees the pricing process to ensure policies and procedures are being followed; and provides guidance on internal controls and valuation-related matters. The Valuation Committee provides periodic reporting to the Board on valuation matters.
Various valuation techniques and inputs are used to determine the fair value of financial instruments. GAAP establishes the following fair value hierarchy that categorizes the inputs used to measure fair value:
Level 1 – quoted prices (unadjusted) in active markets for identical financial instruments that the fund can access at the reporting date
Level 2 – inputs other than Level 1 quoted prices that are observable, either directly or indirectly (including, but not limited to, quoted prices for similar financial instruments in active markets, quoted prices for identical or similar financial instruments in inactive markets, interest rates and yield curves, implied volatilities, and credit spreads)
Level 3 – unobservable inputs (including the fund’s own assumptions in determining fair value)
Observable inputs are developed using market data, such as publicly available information about actual events or transactions, and reflect the assumptions that market participants would use to price the financial instrument. Unobservable inputs are those for which market data are not available and are developed using the best information available about the assumptions that market participants would use to price the financial instrument. GAAP requires valuation techniques to maximize the use of relevant observable inputs and minimize the use of unobservable inputs. When multiple inputs are used to derive fair value, the financial instrument is assigned to the level within the fair value hierarchy based on the lowest-level input that is significant to the fair value of the financial instrument. Input levels are not necessarily an indication of the risk or liquidity associated with financial instruments at that level but rather the degree of judgment used in determining those values.
Valuation Techniques Equity securities, including exchange-traded funds, listed or regularly traded on a securities exchange or in the over-the-counter (OTC) market are valued at the last quoted sale price or, for certain markets, the official closing price at the time the valuations are made. OTC Bulletin Board securities are valued at the mean of the closing bid and asked prices. A security that is listed or traded on more than one exchange is valued at the quotation on the exchange determined to be the primary market for such security. Listed securities not traded on a particular day are valued at the mean of the closing bid and asked prices for domestic securities and the last quoted sale or closing price for international securities.
The last quoted prices of non-U.S. equity securities may be adjusted to reflect the fair value of such securities at the close of the NYSE, if the fund determines that developments between the close of a foreign market and the close of the NYSE will affect the value of some or all of its portfolio securities. Each business day, the fund uses information from outside pricing services to evaluate and, if appropriate, decide whether it is necessary to adjust quoted prices to reflect fair value by reviewing a variety of factors, including developments in foreign markets, the performance of U.S. securities markets, and the performance of instruments trading in U.S. markets that represent foreign securities and baskets of foreign securities. The fund uses outside pricing services to provide it with quoted prices and information to evaluate or adjust those prices. The fund cannot predict how often it will use quoted prices and how often it will determine it necessary to adjust those prices to reflect fair value.
Investments in mutual funds are valued at the mutual fund’s closing NAV per share on the day of valuation. Assets and liabilities other than financial instruments, including short-term receivables and payables, are carried at cost, or estimated realizable value, if less, which approximates fair value.
Investments for which market quotations or market-based valuations are not readily available or deemed unreliable are valued at fair value as determined in good faith by the Valuation Committee, in accordance with fair valuation policies and procedures. The objective of any fair value pricing determination is to arrive at a price that could reasonably be expected from a current sale. Financial instruments fair valued by the Valuation Committee are primarily private placements, restricted securities, warrants, rights, and other securities that are not publicly traded. Factors used in determining fair value vary by type of investment and may include market or investment specific considerations. The Valuation Committee typically will afford greatest weight to actual prices in arm’s length transactions, to the extent they represent orderly transactions between market participants, transaction information can be reliably obtained, and prices are deemed representative of fair value. However, the Valuation Committee may also consider other valuation methods such as market-based valuation multiples; a discount or premium from market value of a similar, freely traded security of the same issuer; discounted cash flows; yield to maturity; or some combination. Fair value determinations are reviewed on a regular basis and updated as information becomes available, including actual purchase and sale transactions of the investment. Because any fair value determination involves a significant amount of judgment, there is a degree of subjectivity inherent in such pricing decisions, and fair value prices determined by the Valuation Committee could differ from those of other market participants.
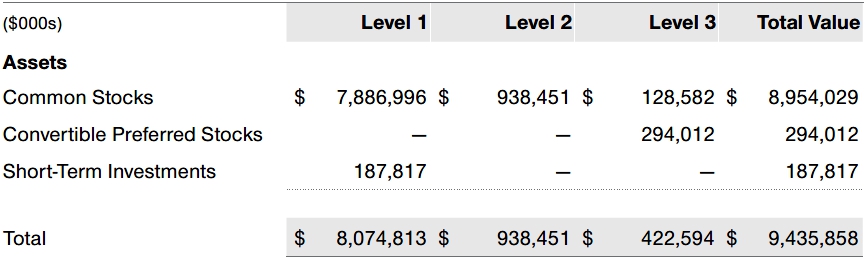
Valuation Inputs The following table summarizes the fund’s financial instruments, based on the inputs used to determine their fair values on June 30, 2021 (for further detail by category, please refer to the accompanying Portfolio of Investments):
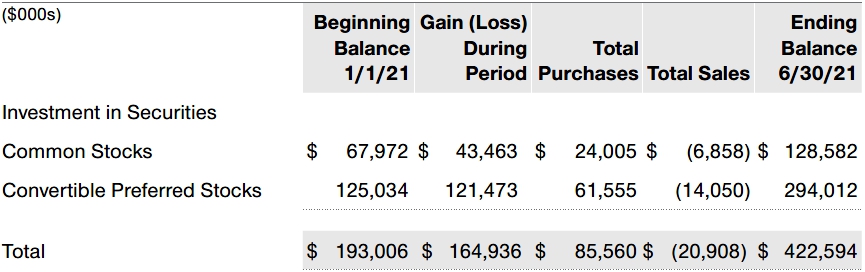
Following is a reconciliation of the fund’s Level 3 holdings for the six months ended June 30, 2021. Gain (loss) reflects both realized and change in unrealized gain/loss on Level 3 holdings during the period, if any, and is included on the accompanying Statement of Operations. The change in unrealized gain/loss on Level 3 instruments held at June 30, 2021, totaled $180,072,000 for the six months ended June 30, 2021.
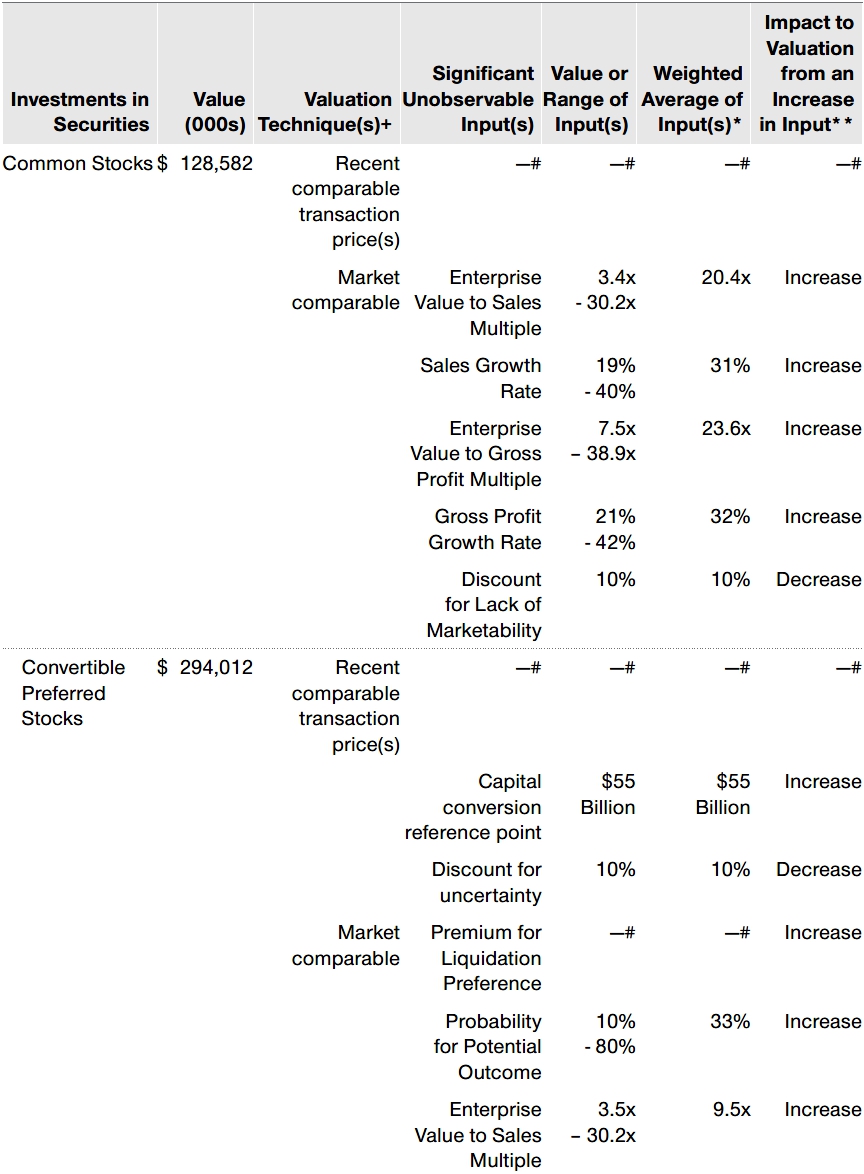
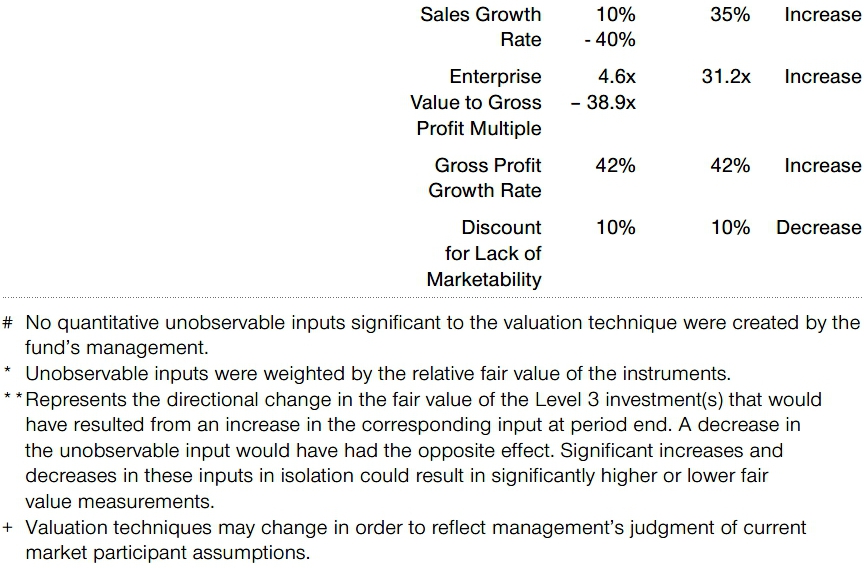
In accordance with GAAP, the following table provides quantitative information about significant unobservable inputs used to determine the fair valuations of the fund’s Level 3 assets, by class of financial instrument. Because the Valuation Committee considers a wide variety of factors and inputs, both observable and unobservable, in determining fair values, the unobservable inputs presented do not reflect all inputs significant to the fair value determination.
NOTE 3 – OTHER INVESTMENT TRANSACTIONS
Consistent with its investment objective, the fund engages in the following practices to manage exposure to certain risks and/or to enhance performance. The investment objective, policies, program, and risk factors of the fund are described more fully in the fund’s prospectus and Statement of Additional Information.
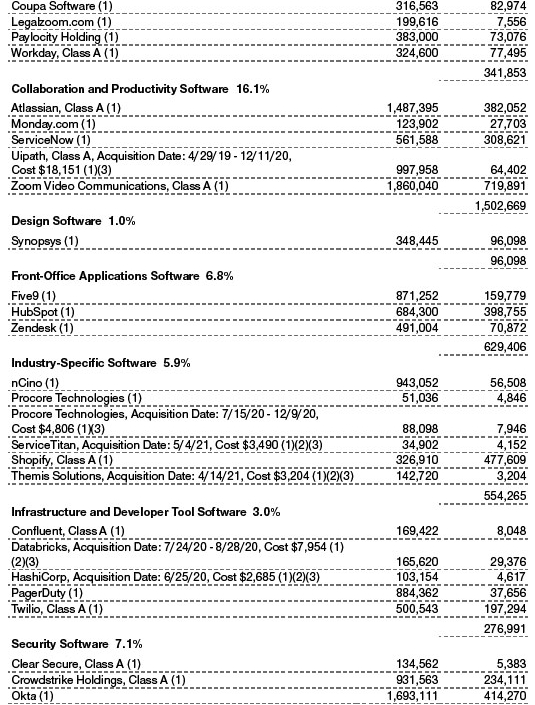
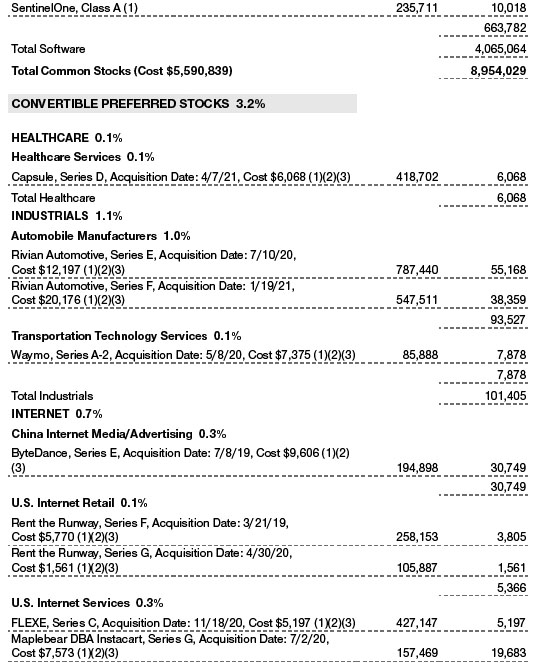
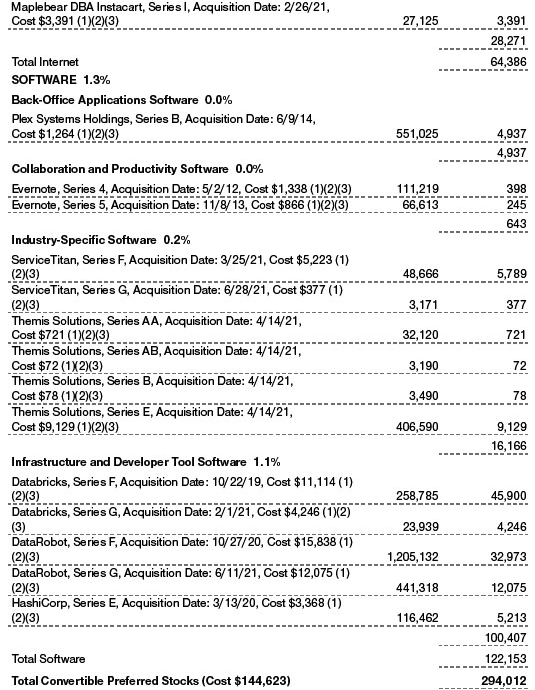
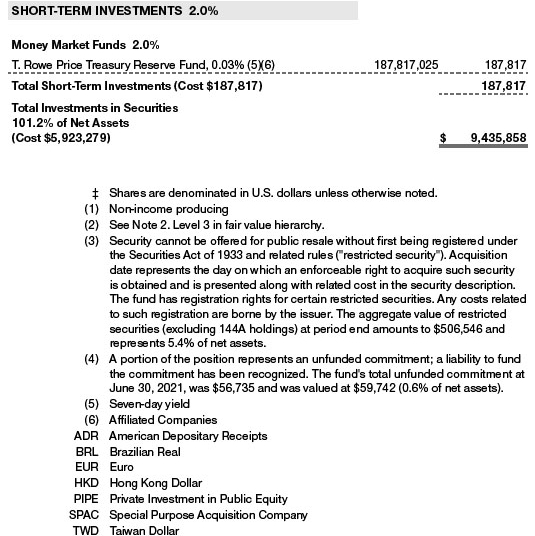
Restricted Securities The fund invests in securities that are subject to legal or contractual restrictions on resale. Prompt sale of such securities at an acceptable price may be difficult and may involve substantial delays and additional costs.
Other Purchases and sales of portfolio securities other than short-term securities aggregated $3,839,176,000 and $3,987,137,000, respectively, for the six months ended June 30, 2021.
NOTE 4 – FEDERAL INCOME TAXES
No provision for federal income taxes is required since the fund intends to continue to qualify as a regulated investment company under Subchapter M of the Internal Revenue Code and distribute to shareholders all of its taxable income and gains. Distributions determined in accordance with federal income tax regulations may differ in amount or character from net investment income and realized gains for financial reporting purposes. Financial reporting records are adjusted for permanent book/tax differences to reflect tax character but are not adjusted for temporary differences. The amount and character of tax-basis distributions and composition of net assets are finalized at fiscal year-end; accordingly, tax-basis balances have not been determined as of the date of this report.
At June 30, 2021, the cost of investments for federal income tax purposes was $5,946,591,000. Net unrealized gain aggregated $3,489,267,000 at period-end, of which $3,552,039,000 related to appreciated investments and $62,772,000 related to depreciated investments.
NOTE 5 – FOREIGN TAXES
The fund is subject to foreign income taxes imposed by certain countries in which it invests. Additionally, capital gains realized upon disposition of securities issued in or by certain foreign countries are subject to capital gains tax imposed by those countries. All taxes are computed in accordance with the applicable foreign tax law, and, to the extent permitted, capital losses are used to offset capital gains. Taxes attributable to income are accrued by the fund as a reduction of income. Current and deferred tax expense attributable to capital gains is reflected as a component of realized or change in unrealized gain/loss on securities in the accompanying financial statements. To the extent that the fund has country specific capital loss carryforwards, such carryforwards are applied against net unrealized gains when determining the deferred tax liability. Any deferred tax liability incurred by the fund is included in either Other liabilities or Deferred tax liability on the accompanying Statement of Assets and Liabilities.
NOTE 6 – RELATED PARTY TRANSACTIONS
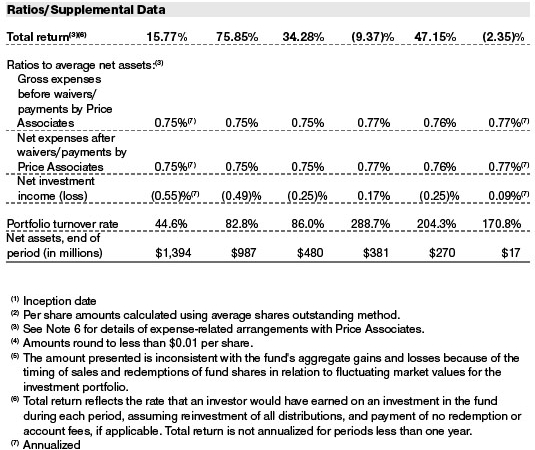
The fund is managed by T. Rowe Price Associates, Inc. (Price Associates), a wholly owned subsidiary of T. Rowe Price Group, Inc. (Price Group). The investment management agreement between the fund and Price Associates provides for an annual investment management fee, which is computed daily and paid monthly. The fee consists of an individual fund fee, equal to 0.45% of the fund’s average daily net assets, and a group fee. The group fee rate is calculated based on the combined net assets of certain mutual funds sponsored by Price Associates (the group) applied to a graduated fee schedule, with rates ranging from 0.48% for the first $1 billion of assets to 0.260% for assets in excess of $845 billion. The fund’s group fee is determined by applying the group fee rate to the fund’s average daily net assets. The fee is computed daily and paid monthly. At June 30, 2021, the effective annual group fee rate was 0.28%.
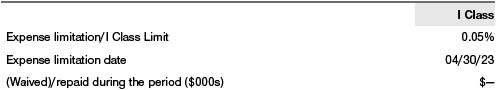
The I Class is subject to an operating expense limitation (I Class Limit) pursuant to which Price Associates is contractually required to pay all operating expenses of the I Class, excluding management fees; interest; expenses related to borrowings, taxes, and brokerage; and other non-recurring expenses permitted by the investment management agreement, to the extent such operating expenses, on an annualized basis, exceed the I Class Limit. This agreement will continue through the expense limitation date indicated in the table below, and may be renewed, revised, or revoked only with approval of the fund’s Board. The I Class is required to repay Price Associates for expenses previously paid to the extent the class’s net assets grow or expenses decline sufficiently to allow repayment without causing the class’s operating expenses (after the repayment is taken into account) to exceed the lesser of: (1) the I Class Limit in place at the time such amounts were paid; or (2) the current I Class Limit. However, no repayment will be made more than three years after the date of a payment or waiver.
In addition, the fund has entered into service agreements with Price Associates and two wholly owned subsidiaries of Price Associates, each an affiliate of the fund (collectively, Price). Price Associates provides certain accounting and administrative services to the fund. T. Rowe Price Services, Inc. provides shareholder and administrative services in its capacity as the fund’s transfer and dividend-disbursing agent. T. Rowe Price Retirement Plan Services, Inc. provides subaccounting and recordkeeping services for certain retirement accounts invested in the Investor Class. For the six months ended June 30, 2021, expenses incurred pursuant to these service agreements were $35,000 for Price Associates; $1,050,000 for T. Rowe Price Services, Inc.; and $146,000 for T. Rowe Price Retirement Plan Services, Inc. All amounts due to and due from Price, exclusive of investment management fees payable, are presented net on the accompanying Statement of Assets and Liabilities.
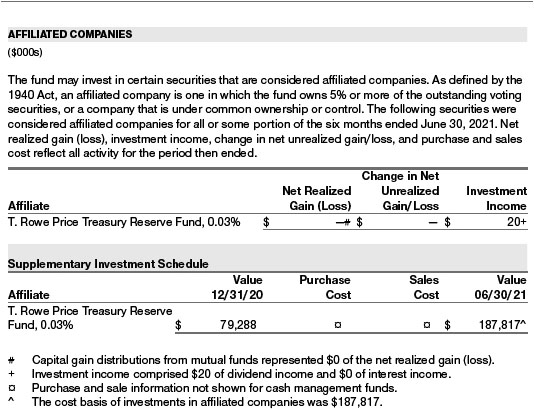
The fund may invest its cash reserves in certain open-end management investment companies managed by Price Associates and considered affiliates of the fund: the T. Rowe Price Government Reserve Fund or the T. Rowe Price Treasury Reserve Fund, organized as money market funds, or the T. Rowe Price Short-Term Fund, a short-term bond fund (collectively, the Price Reserve Funds). The Price Reserve Funds are offered as short-term investment options to mutual funds, trusts, and other accounts managed by Price Associates or its affiliates and are not available for direct purchase by members of the public. Cash collateral from securities lending is invested in the T. Rowe Price Short-Term Fund. The Price Reserve Funds pay no investment management fees.
As of June 30, 2021, T. Rowe Price Group, Inc., or its wholly owned subsidiaries, owned 368,068 shares of the I Class, representing 1% of the I Class’s net assets.
The fund may participate in securities purchase and sale transactions with other funds or accounts advised by Price Associates (cross trades), in accordance with procedures adopted by the fund’s Board and Securities and Exchange Commission rules, which require, among other things, that such purchase and sale cross trades be effected at the independent current market price of the security. During the six months ended June 30, 2021, the fund had no purchases or sales cross trades with other funds or accounts advised by Price Associates.
Effective January 1, 2020, Price Associates has voluntarily agreed to reimburse the fund from its own resources on a monthly basis for the cost of investment research embedded in the cost of the fund’s securities trades. This agreement may be rescinded at any time. For the six months ended June 30, 2021, this reimbursement amounted to $350,000, which is included in Net realized gain (loss) on Securities in the Statement of Operations.
NOTE 7 – OTHER MATTERS
Unpredictable events such as environmental or natural disasters, war, terrorism, pandemics, outbreaks of infectious diseases, and similar public health threats may significantly affect the economy and the markets and issuers in which a fund invests. Certain events may cause instability across global markets, including reduced liquidity and disruptions in trading markets, while some events may affect certain geographic regions, countries, sectors, and industries more significantly than others, and exacerbate other pre-existing political, social, and economic risks. During 2020, a novel strain of coronavirus (COVID-19) resulted in disruptions to global business activity and caused significant volatility and declines in global financial markets.
These types of events, such as the global pandemic caused by COVID-19, may also cause widespread fear and uncertainty, and result in, among other things: enhanced health screenings, quarantines, cancellations, and travel restrictions, including border closings; disruptions to business operations and supply chains and customer activity; exchange trading suspensions and closures, and overall reduced liquidity of securities, derivatives, and commodities trading markets; reductions in consumer demand and economic output; and significant challenges in healthcare service preparation and delivery. The fund could be negatively impacted if the value of a portfolio holding were harmed by such political or economic conditions or events. In addition, the operations of the fund, its investment advisers, and the fund’s service providers may be significantly impacted, or even temporarily halted, as a result of any impairment to their information technology and other operation systems, extensive employee illnesses or unavailability, government quarantine measures, and restrictions on travel or meetings and other factors related to public emergencies.
Governmental and quasi-governmental authorities and regulators have in the past responded to major economic disruptions with a variety of significant fiscal and monetary policy changes, including but not limited to, direct capital infusions into companies, new monetary programs, and dramatically lower interest rates. An unexpected or quick reversal of these policies, or the ineffectiveness of these policies, could negatively impact overall investor sentiment and further increase volatility in securities markets.
INFORMATION ON PROXY VOTING POLICIES, PROCEDURES, AND RECORDS
A description of the policies and procedures used by T. Rowe Price funds to determine how to vote proxies relating to portfolio securities is available in each fund’s Statement of Additional Information. You may request this document by calling 1-800-225-5132 or by accessing the SEC’s website, sec.gov.
The description of our proxy voting policies and procedures is also available on our corporate website. To access it, please visit the following Web page:
https://www.troweprice.com/corporate/en/utility/policies.html
Scroll down to the section near the bottom of the page that says, “Proxy Voting Policies.” Click on the Proxy Voting Policies link in the shaded box.
Each fund’s most recent annual proxy voting record is available on our website and through the SEC’s website. To access it through T. Rowe Price, visit the website location shown above, and scroll down to the section near the bottom of the page that says, “Proxy Voting Records.” Click on the Proxy Voting Records link in the shaded box.
HOW TO OBTAIN QUARTERLY PORTFOLIO HOLDINGS
The fund files a complete schedule of portfolio holdings with the Securities and Exchange Commission (SEC) for the first and third quarters of each fiscal year as an exhibit to its reports on Form N-PORT. The fund’s reports on Form N-PORT are available electronically on the SEC’s website (sec.gov). In addition, most T. Rowe Price funds disclose their first and third fiscal quarter-end holdings on troweprice.com.
APPROVAL OF INVESTMENT MANAGEMENT AGREEMENT
Each year, the fund’s Board of Directors (Board) considers the continuation of the investment management agreement (Advisory Contract) between the fund and its investment advisor, T. Rowe Price Associates, Inc. (Advisor). In that regard, at a meeting held on March 8–9, 2021 (Meeting), the Board, including all of the fund’s independent directors, approved the continuation of the fund’s Advisory Contract. At the Meeting, the Board considered the factors and reached the conclusions described below relating to the selection of the Advisor and the approval of the Advisory Contract. The independent directors were assisted in their evaluation of the Advisory Contract by independent legal counsel from whom they received separate legal advice and with whom they met separately.
In providing information to the Board, the Advisor was guided by a detailed set of requests for information submitted by independent legal counsel on behalf of the independent directors. In considering and approving the Advisory Contract, the Board considered the information it believed was relevant, including, but not limited to, the information discussed below. The Board considered not only the specific information presented in connection with the Meeting but also the knowledge gained over time through interaction with the Advisor about various topics. The Board meets regularly and, at each of its meetings, covers an extensive agenda of topics and materials and considers factors that are relevant to its annual consideration of the renewal of the T. Rowe Price funds’ advisory contracts, including performance and the services and support provided to the funds and their shareholders.
Services Provided by the Advisor
The Board considered the nature, quality, and extent of the services provided to the fund by the Advisor. These services included, but were not limited to, directing the fund’s investments in accordance with its investment program and the overall management of the fund’s portfolio, as well as a variety of related activities such as financial, investment operations, and administrative services; compliance; maintaining the fund’s records and registrations; and shareholder communications. The Board also reviewed the background and experience of the Advisor’s senior management team and investment personnel involved in the management of the fund, as well as the Advisor’s compliance record. The Board concluded that it was satisfied with the nature, quality, and extent of the services provided by the Advisor.
Investment Performance of the Fund
The Board took into account discussions with the Advisor and reports that it receives throughout the year relating to fund performance. In connection with the Meeting, the Board reviewed the fund’s net annualized total returns for the 1-, 2-, 3-, 4-, 5-, and 10-year periods as of September 30, 2020, and compared these returns with the performance of a peer group of funds with similar investment programs and a wide variety of other previously agreed-upon comparable performance measures and market data, including those supplied by Broadridge, which is an independent provider of mutual fund data.
On the basis of this evaluation and the Board’s ongoing review of investment results, and factoring in the relative market conditions during certain of the performance periods, the Board concluded that the fund’s performance was satisfactory.
Costs, Benefits, Profits, and Economies of Scale
The Board reviewed detailed information regarding the revenues received by the Advisor under the Advisory Contract and other direct and indirect benefits that the Advisor (and its affiliates) may have realized from its relationship with the fund. In considering soft-dollar arrangements pursuant to which research may be received from broker-dealers that execute the fund’s portfolio transactions, the Board noted that the Advisor bears the cost of research services for all client accounts that it advises, including the T. Rowe Price funds. The Board received information on the estimated costs incurred and profits realized by the Advisor from managing the T. Rowe Price funds. The Board also reviewed estimates of the profits realized from managing the fund in particular, and the Board concluded that the Advisor’s profits were reasonable in light of the services provided to the fund.
The Board also considered whether the fund benefits under the fee levels set forth in the Advisory Contract from any economies of scale realized by the Advisor. Under the Advisory Contract, the fund pays a fee to the Advisor for investment management services composed of two components—a group fee rate based on the combined average net assets of most of the T. Rowe Price funds (including the fund) that declines at certain asset levels and an individual fund fee rate based on the fund’s average daily net assets—and the fund pays its own expenses of operations. The Board concluded that the advisory fee structure for the fund continued to provide for a reasonable sharing of benefits from any economies of scale with the fund’s investors.
Fees and Expenses
The Board was provided with information regarding industry trends in management fees and expenses. Among other things, the Board reviewed data for peer groups that were compiled by Broadridge, which compared: (i) contractual management fees, total expenses, actual management fees, and nonmanagement expenses of the Investor Class of the fund with a group of competitor funds selected by Broadridge (Expense Group) and (ii) total expenses, actual management fees, and nonmanagement expenses of the Investor Class of the fund with a broader set of funds within the Lipper investment classification (Expense Universe). The Board considered the fund’s contractual management fee rate, actual management fee rate (which reflects the management fees actually received from the fund by the Advisor after any applicable waivers, reductions, or reimbursements), operating expenses, and total expenses (which reflect the net total expense ratio of the fund after any waivers, reductions, or reimbursements) in comparison with the information for the Broadridge peer groups. Broadridge generally constructed the peer groups by seeking the most comparable funds based on similar investment classifications and objectives, expense structure, asset size, and operating components and attributes and ranked funds into quintiles, with the first quintile representing the funds with the lowest relative expenses and the fifth quintile representing the funds with the highest relative expenses. The information provided to the Board indicated that the fund’s contractual management fee ranked in the third quintile (Expense Group), the fund’s actual management fee rate ranked in the fourth quintile (Expense Group and Expense Universe), and the fund’s total expenses ranked in the second and third quintiles (Expense Group) and first and third quintiles (Expense Universe).
The Board also reviewed the fee schedules for other investment portfolios with similar mandates that are advised or subadvised by the Advisor and its affiliates, including separately managed accounts for institutional and individual investors; subadvised funds; and other sponsored investment portfolios, including collective investment trusts and pooled vehicles organized and offered to investors outside the United States. Management provided the Board with information about the Advisor’s responsibilities and services provided to subadvisory and other institutional account clients, including information about how the requirements and economics of the institutional business are fundamentally different from those of the proprietary mutual fund business. The Board considered information showing that the Advisor’s mutual fund business is generally more complex from a business and compliance perspective than its institutional account business and considered various relevant factors, such as the broader scope of operations and oversight, more extensive shareholder communication infrastructure, greater asset flows, heightened business risks, and differences in applicable laws and regulations associated with the Advisor’s proprietary mutual fund business. In assessing the reasonableness of the fund’s management fee rate, the Board considered the differences in the nature of the services required for the Advisor to manage its mutual fund business versus managing a discrete pool of assets as a subadvisor to another institution’s mutual fund or for an institutional account and that the Advisor generally performs significant additional services and assumes greater risk in managing the fund and other T. Rowe Price funds than it does for institutional account clients, including subadvised funds.
On the basis of the information provided and the factors considered, the Board concluded that the fees paid by the fund under the Advisory Contract are reasonable.
Approval of the Advisory Contract
As noted, the Board approved the continuation of the Advisory Contract. No single factor was considered in isolation or to be determinative to the decision. Rather, the Board concluded, in light of a weighting and balancing of all factors considered, that it was in the best interests of the fund and its shareholders for the Board to approve the continuation of the Advisory Contract (including the fees to be charged for services thereunder).
Item 1. (b) Notice pursuant to Rule 30e-3.
Not applicable.
Item 2. Code of Ethics.
A code of ethics, as defined in Item 2 of Form N-CSR, applicable to its principal executive officer, principal financial officer, principal accounting officer or controller, or persons performing similar functions is filed as an exhibit to the registrants annual Form N-CSR. No substantive amendments were approved or waivers were granted to this code of ethics during the registrants most recent fiscal half-year.
Item 3. Audit Committee Financial Expert.
Disclosure required in registrants annual Form N-CSR.
Item 4. Principal Accountant Fees and Services.
Disclosure required in registrants annual Form N-CSR.
Item 5. Audit Committee of Listed Registrants.
Not applicable.
Item 6. Investments.
(a) Not applicable. The complete schedule of investments is included in Item 1 of this Form N-CSR.
(b) Not applicable.
Item 7. Disclosure of Proxy Voting Policies and Procedures for Closed-End Management Investment Companies.
Not applicable.
Item 8. Portfolio Managers of Closed-End Management Investment Companies.
Not applicable.
Item 9. Purchases of Equity Securities by Closed-End Management Investment Company and Affiliated Purchasers.
Not applicable.
Item 10. Submission of Matters to a Vote of Security Holders.
There has been no change to the procedures by which shareholders may recommend nominees to the
registrant’s board of directors.
Item 11. Controls and Procedures.
(a) The registrants principal executive officer and principal financial officer have evaluated the registrants disclosure controls and procedures within 90 days of this filing and have concluded that the registrants disclosure controls and procedures were effective, as of that date, in ensuring that information required to be disclosed by the registrant in this Form N-CSR was recorded, processed, summarized, and reported timely.
(b) The registrants principal executive officer and principal financial officer are aware of no change
in the registrants internal control over financial reporting that occurred during the period covered by this report that has materially affected, or is reasonably likely to materially affect, the registrants internal control over financial reporting.
Item 12. Disclosure of Securities Lending Activities for Closed-End Management Investment Companies.
Not applicable.
Item 13. Exhibits.
(a)(1) The registrants code of ethics pursuant to Item 2 of Form N-CSR is filed with the registrants annual Form N-CSR.
(2) Separate certifications by the registrant’s principal executive officer and principal financial officer, pursuant to Section 302 of the Sarbanes-Oxley Act of 2002 and required by Rule 30a-2(a) under the Investment Company Act of 1940, are attached.
(3) Written solicitation to repurchase securities issued by closed-end companies: not applicable.
(b) A certification by the registrant’s principal executive officer and principal financial officer, pursuant to Section 906 of the Sarbanes-Oxley Act of 2002 and required by Rule 30a-2(b) under the Investment Company Act of 1940, is attached.
SIGNATURES
Pursuant to the requirements of the
Securities Exchange Act of 1934 and the Investment Company Act of 1940, the
registrant has duly caused this report to be signed on its behalf by the
undersigned, thereunto duly authorized.
T. Rowe Price Global Technology Fund, Inc.
| By | /s/ David Oestreicher |
|||||
| David Oestreicher | ||||||
| Principal Executive Officer |
||||||
| Date | August 17, 2021 | |||||
Pursuant to the requirements of the
Securities Exchange Act of 1934 and the Investment Company Act of 1940, this
report has been signed below by the following persons on behalf of the
registrant and in the capacities and on the dates indicated.
| By | /s/ David Oestreicher |
|||||
| David Oestreicher | ||||||
| Principal Executive Officer |
||||||
| Date | August 17, 2021 |
|||||
| By | /s/ Alan S. Dupski |
|||||
| Alan S. Dupski | ||||||
| Principal Financial Officer | ||||||
| Date | August 17, 2021 |
|||||
Item 13. (a)(2)
CERTIFICATIONS
I, David Oestreicher, certify that:
| 1. | I have reviewed this report on Form N-CSR of T. Rowe Price Global Technology Fund; |
|||
| 2. | Based on my knowledge, this report does not contain any untrue statement of a material fact or omit to state a material fact necessary to make the statements made, in light of the circumstances under which such statements were made, not misleading with respect to the period covered by this report; |
|||
| 3. | Based on my knowledge, the financial statements, and other financial information included in this report, fairly present in all material respects the financial condition, results of operations, changes in net assets, and cash flows (if the financial statements are required to include a statement of cash flows) of the registrant as of, and for, the periods presented in this report; |
|||
| 4. | The registrant’s other certifying officer(s) and I are responsible for establishing and maintaining disclosure controls and procedures (as defined in rule 30a-3(c) under the Investment Company Act of 1940) and internal control over financial reporting (as defined in Rule 30a-3(d) under the Investment Company Act of 1940) for the registrant and have: |
|||
| (a) | Designed such disclosure controls and procedures, or caused such disclosure controls and procedures to be designed under our supervision, to ensure that material information relating to the registrant, including its consolidated subsidiaries, is made known to us by others within those entities, particularly during the period in which this report is being prepared; |
|||
| (b) | Designed such internal control over financial reporting, or caused such internal control over financial reporting to be designed under our supervision, to provide reasonable assurance regarding the reliability of financial reporting and the preparation of financial statements for external purposes in accordance with generally accepted accounting principles; |
|||
| (c) | Evaluated the effectiveness of the registrant’s disclosure controls and procedures and presented in this report our conclusions about the effectiveness of the disclosure controls and procedures, as of a date within 90 days prior to the filing date of this report based on such evaluation; and |
|||
| (d) | Disclosed in this report any change in the registrants internal control over financial reporting that occurred during the period covered by this report that has materially affected, or is reasonably likely to materially affect, the registrants internal control over financial reporting; and |
|||
| 5. | The registrant’s other certifying officer(s) and I have disclosed to the registrant’s auditors and the audit committee of the registrant’s board of directors (or persons performing the equivalent functions): |
|||
| (a) | All significant deficiencies and material weaknesses in the design or operation of internal control over financial reporting which are reasonably likely to adversely affect the registrant’s ability to record, process, summarize, and report financial information; and |
|||
| (b) | Any fraud, whether or not material, that involves management or other employees who have a significant role in the registrant’s internal control over financial reporting. |
|||
| Date: August 17, 2021 | /s/ David Oestreicher |
| David Oestreicher | |
| Principal Executive Officer |
CERTIFICATIONS
I, Alan S. Dupski, certify that:
| 1. | I have reviewed this report on Form N-CSR of T. Rowe Price Global Technology Fund; |
|||
| 2. | Based on my knowledge, this report does not contain any untrue statement of a material fact or omit to state a material fact necessary to make the statements made, in light of the circumstances under which such statements were made, not misleading with respect to the period covered by this report; |
|||
| 3. | Based on my knowledge, the financial statements, and other financial information included in this report, fairly present in all material respects the financial condition, results of operations, changes in net assets, and cash flows (if the financial statements are required to include a statement of cash flows) of the registrant as of, and for, the periods presented in this report; |
|||
| 4. | The registrant’s other certifying officer(s) and I are responsible for establishing and maintaining disclosure controls and procedures (as defined in rule 30a-3(c) under the Investment Company Act of 1940) and internal control over financial reporting (as defined in Rule 30a-3(d) under the Investment Company Act of 1940) for the registrant and have: |
|||
| (a) | Designed such disclosure controls and procedures, or caused such disclosure controls and procedures to be designed under our supervision, to ensure that material information relating to the registrant, including its consolidated subsidiaries, is made known to us by others within those entities, particularly during the period in which this report is being prepared; |
|||
| (b) | Designed such internal control over financial reporting, or caused such internal control over financial reporting to be designed under our supervision, to provide reasonable assurance regarding the reliability of financial reporting and the preparation of financial statements for external purposes in accordance with generally accepted accounting principles; |
|||
| (c) | Evaluated the effectiveness of the registrant’s disclosure controls and procedures and presented in this report our conclusions about the effectiveness of the disclosure controls and procedures, as of a date within 90 days prior to the filing date of this report based on such evaluation; and |
|||
| (d) | Disclosed in this report any change in the registrants internal control over financial reporting that occurred during the period covered by this report that has materially affected, or is reasonably likely to materially affect, the registrants internal control over financial reporting; and |
|||
| 5. | The registrant’s other certifying officer(s) and I have disclosed to the registrant’s auditors and the audit committee of the registrant’s board of directors (or persons performing the equivalent functions): |
|||
| (a) | All significant deficiencies and material weaknesses in the design or operation of internal control over financial reporting which are reasonably likely to adversely affect the registrant’s ability to record, process, summarize, and report financial information; and |
|||
| (b) | Any fraud, whether or not material, that involves management or other employees who have a significant role in the registrant’s internal control over financial reporting. |
|||
| Date: August 17, 2021 | /s/ Alan S. Dupski |
| Alan S. Dupski | |
| Principal Financial Officer |
Item 13. (b)
| CERTIFICATION UNDER SECTION 906 OF SARBANES-OXLEY ACT OF 2002 |
||
| Name of Issuer: T. Rowe Price Global Technology Fund | ||
| In connection with the Report on Form N-CSR for the above named Issuer, the undersigned hereby certifies, to the best of his knowledge, that: |
||
| 1. | The Report fully complies with the requirements of Section 13(a) or 15(d) of the Securities Exchange Act of 1934; |
|
| 2. | The information contained in the Report fairly presents, in all material respects, the financial condition and results of operations of the Issuer. |
|
| Date: August 17, 2021 | /s/ David Oestreicher |
| David Oestreicher | |
| Principal Executive Officer |
|
| Date: August 17, 2021 | /s/ Alan S. Dupski |
| Alan S. Dupski | |
| Principal Financial Officer |
|